
The Gold-to-Oil Ratio: Historical Trends and Insights (1980-2024)
-
Jan, Tue, 2025
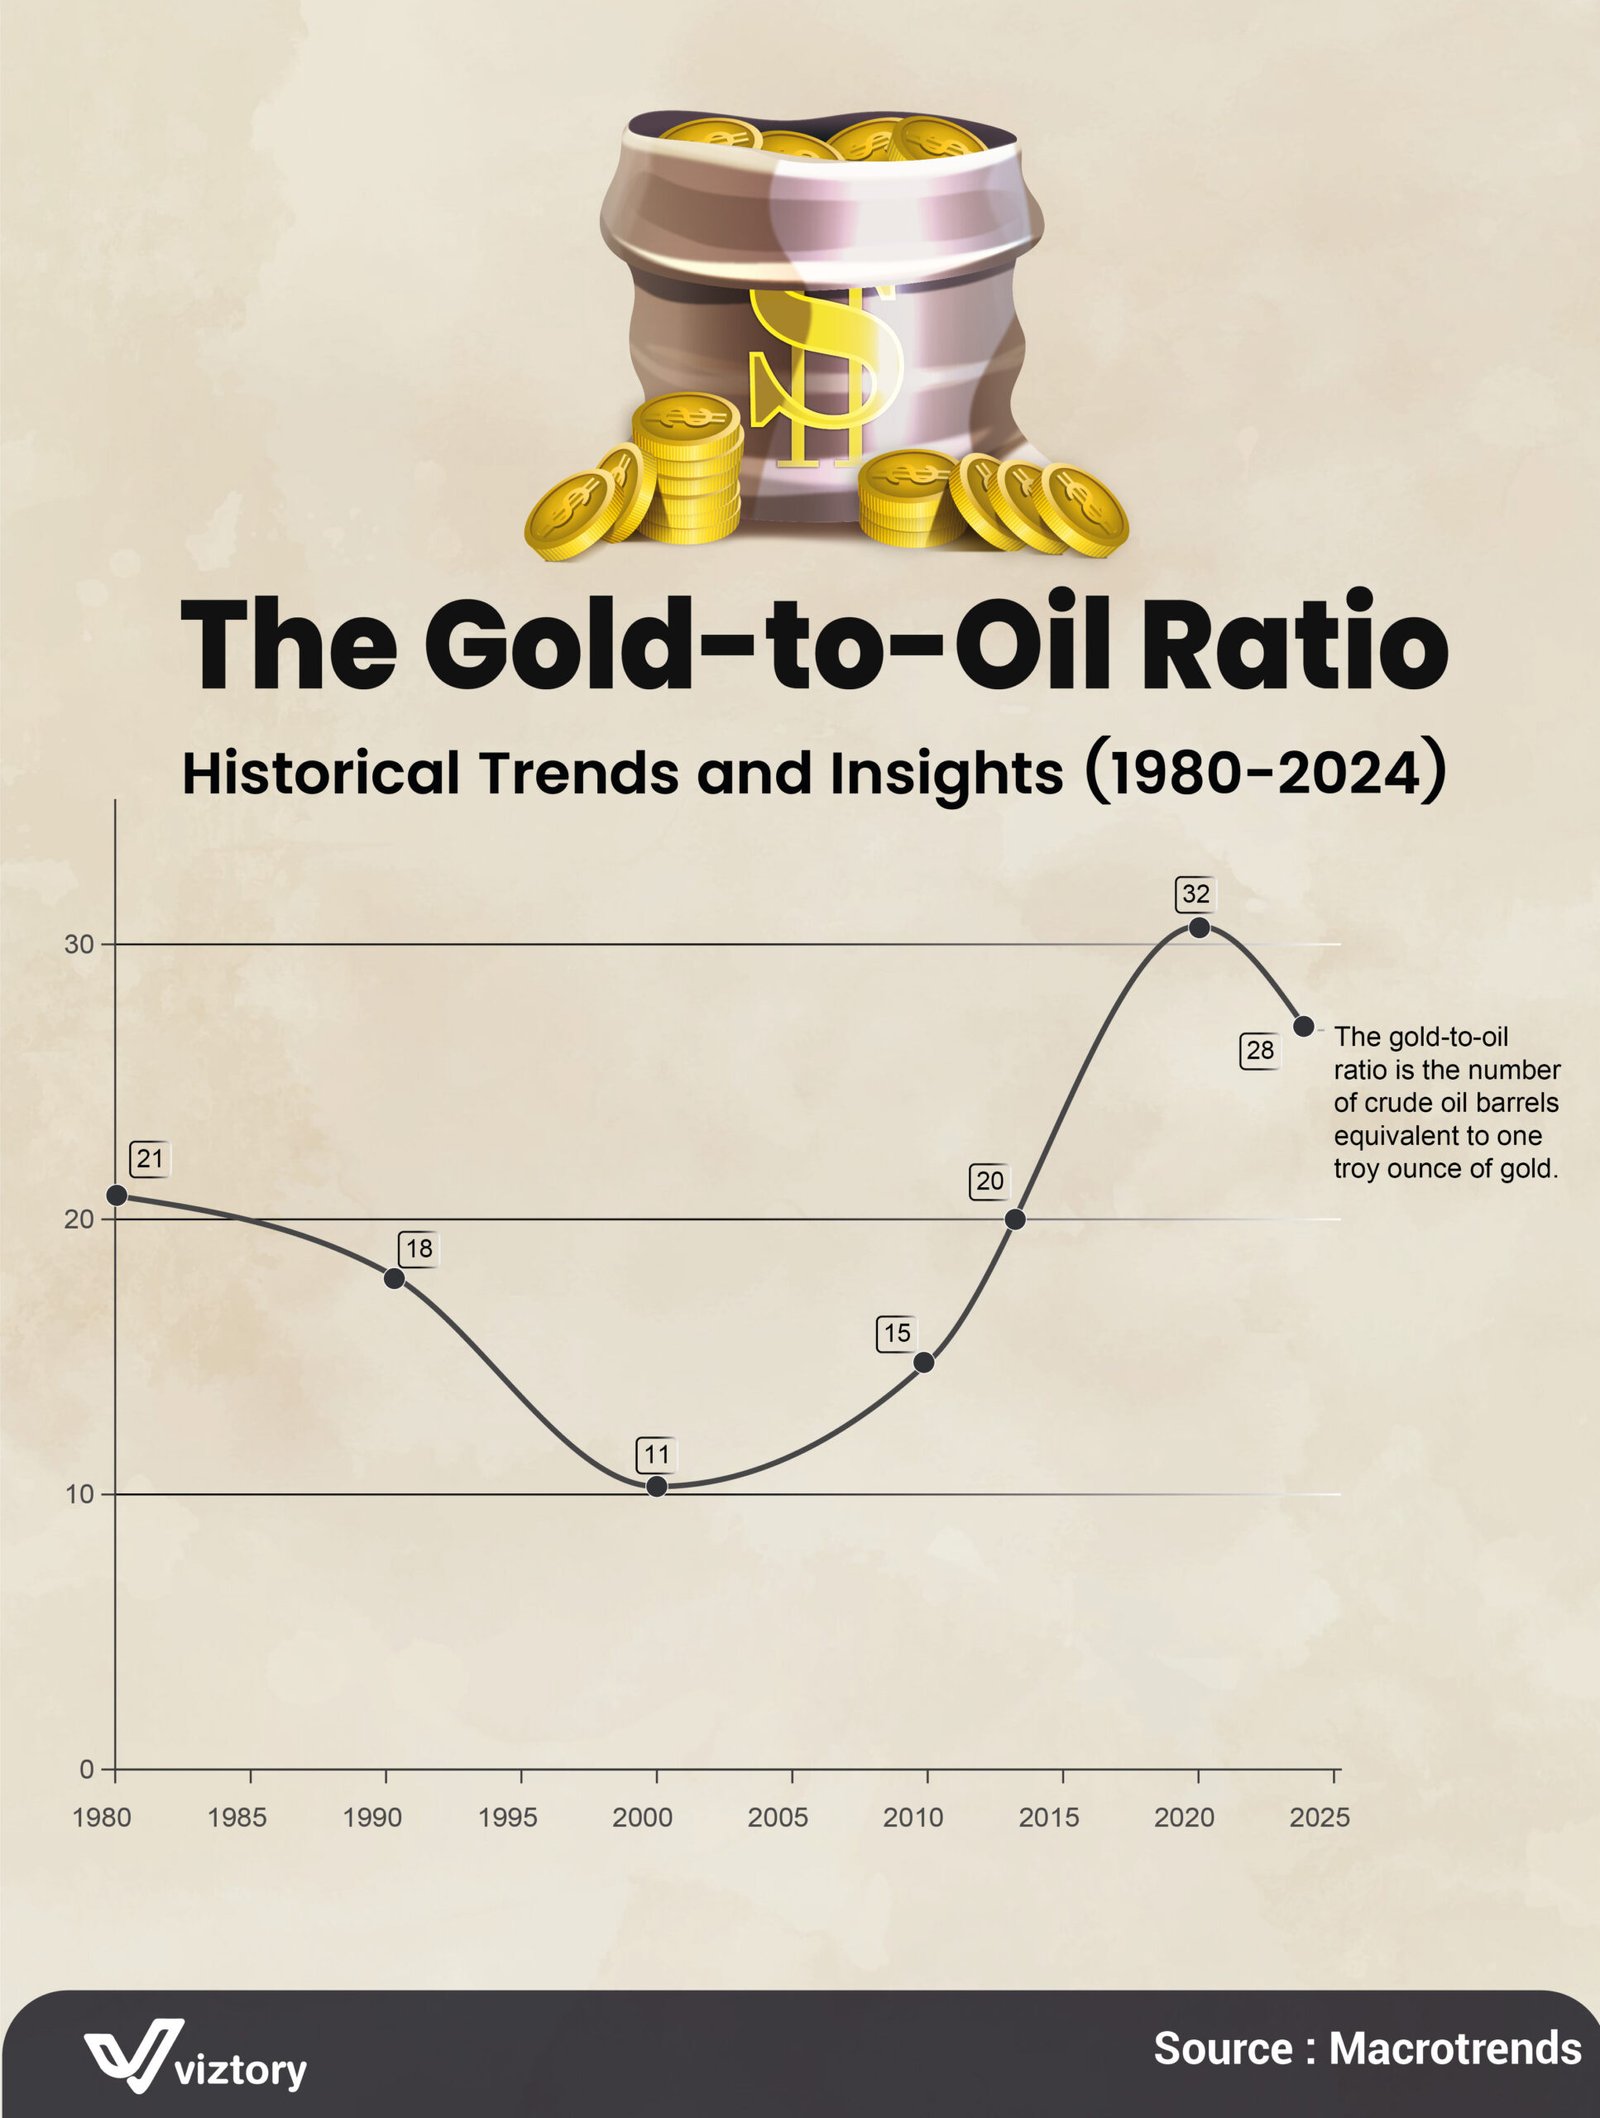
The gold-to-oil ratio is a key economic indicator that compares the value of gold to crude oil, reflecting the number of barrels of oil equivalent to one troy ounce of gold. It has long been a vital metric in analyzing the interplay between commodity markets, currency fluctuations, and global economic stability. This article delves into the historical trends of the ratio from 1980 to 2024 and explores its implications on global markets.
Understanding the Gold-to-Oil Ratio
The gold-to-oil ratio acts as a gauge of inflation, economic cycles, and geopolitical tensions. Historically, periods of economic uncertainty, war, or financial crises tend to elevate the ratio, as gold becomes a safe-haven asset while oil prices might remain volatile or suppressed. Conversely, in times of economic stability and growth, oil prices often rise due to increased demand, reducing the ratio.
Historical Trends: Key Insights
1980-1995: Stability and Decline
In the early 1980s, the ratio hovered around 20, reflecting a relatively balanced global economic environment. However, during the late 1980s and early 1990s, the ratio declined to a low of 11 by the year 2000, driven by strong economic growth and lower gold prices relative to oil.2000-2010: Rise Amid Uncertainty
The early 2000s saw the ratio spike from 11 to 20. Factors such as the dot-com bubble burst, geopolitical tensions, and the 2008 global financial crisis elevated the demand for gold as a safe-haven asset, while oil prices remained volatile.2010-2020: Record Highs and Recovery
By 2010, the ratio rose to 15 but experienced a meteoric rise to 32 by 2020. This historic peak was primarily driven by the COVID-19 pandemic, which caused massive economic disruptions, weakened global oil demand, and skyrocketed gold prices.2021-2024: Normalization
Recent trends reflect a return to equilibrium, with the ratio settling around 28 by 2024. Global recovery efforts, advancements in green energy, and more stable monetary policies contributed to this normalization.
Economic Implications
The gold-to-oil ratio highlights how commodities respond to economic changes:
- Inflation Indicator: A rising ratio often signals inflation fears, as gold’s value increases during periods of monetary expansion.
- Geopolitical Tensions: High ratios are synonymous with crises, where oil supplies might be constrained while investors flock to gold.
- Investment Strategy: Investors use the ratio to guide decisions, determining whether to favor gold or oil based on the economic outlook.
Conclusion
The gold-to-oil ratio is not merely a comparison of two commodities but a mirror reflecting the broader global economic narrative. Its fluctuations over the past four decades underscore the intricate balance between financial markets, geopolitics, and global supply-demand dynamics. As we move toward a future shaped by renewable energy and evolving economic paradigms, the ratio will remain a valuable tool for economists and investors alike.
Source: Macrotrends
Visualization Courtesy: Viztory