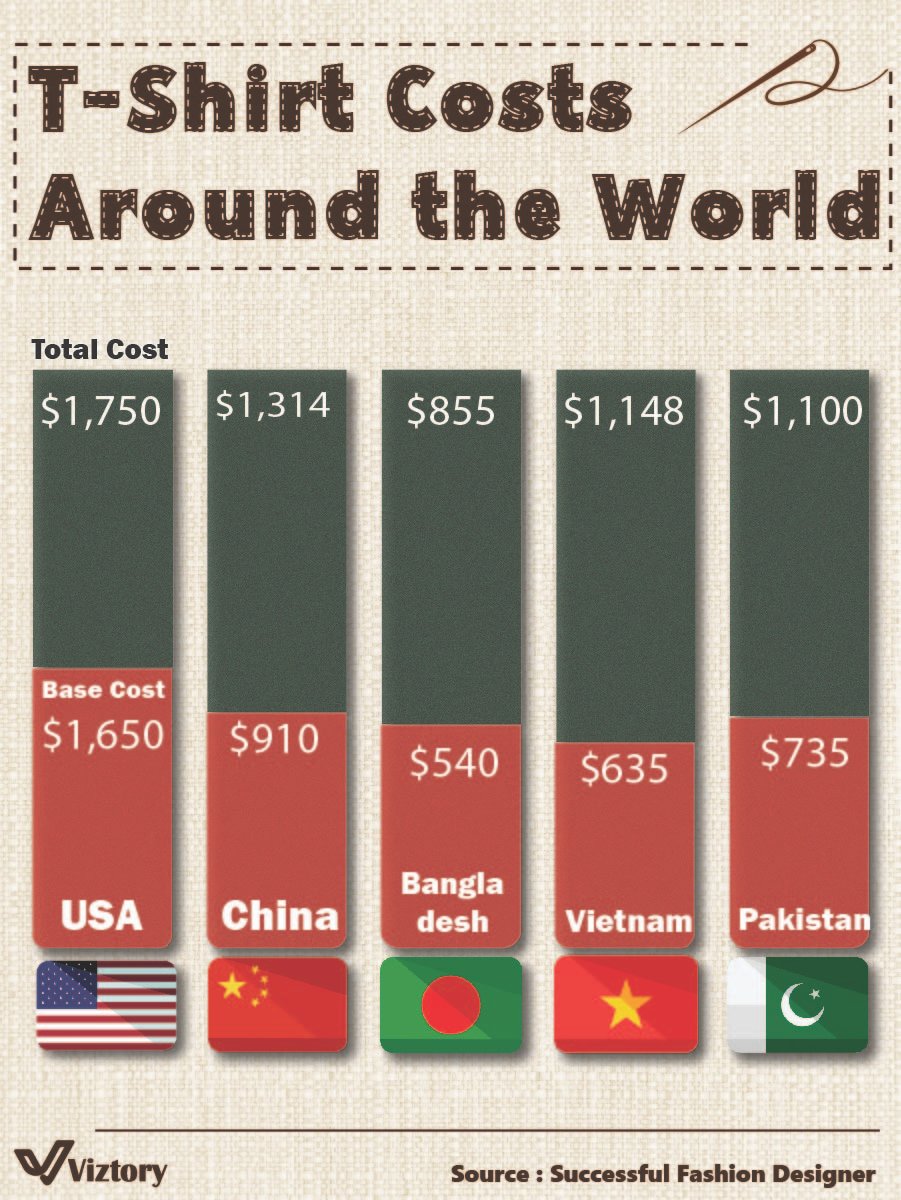
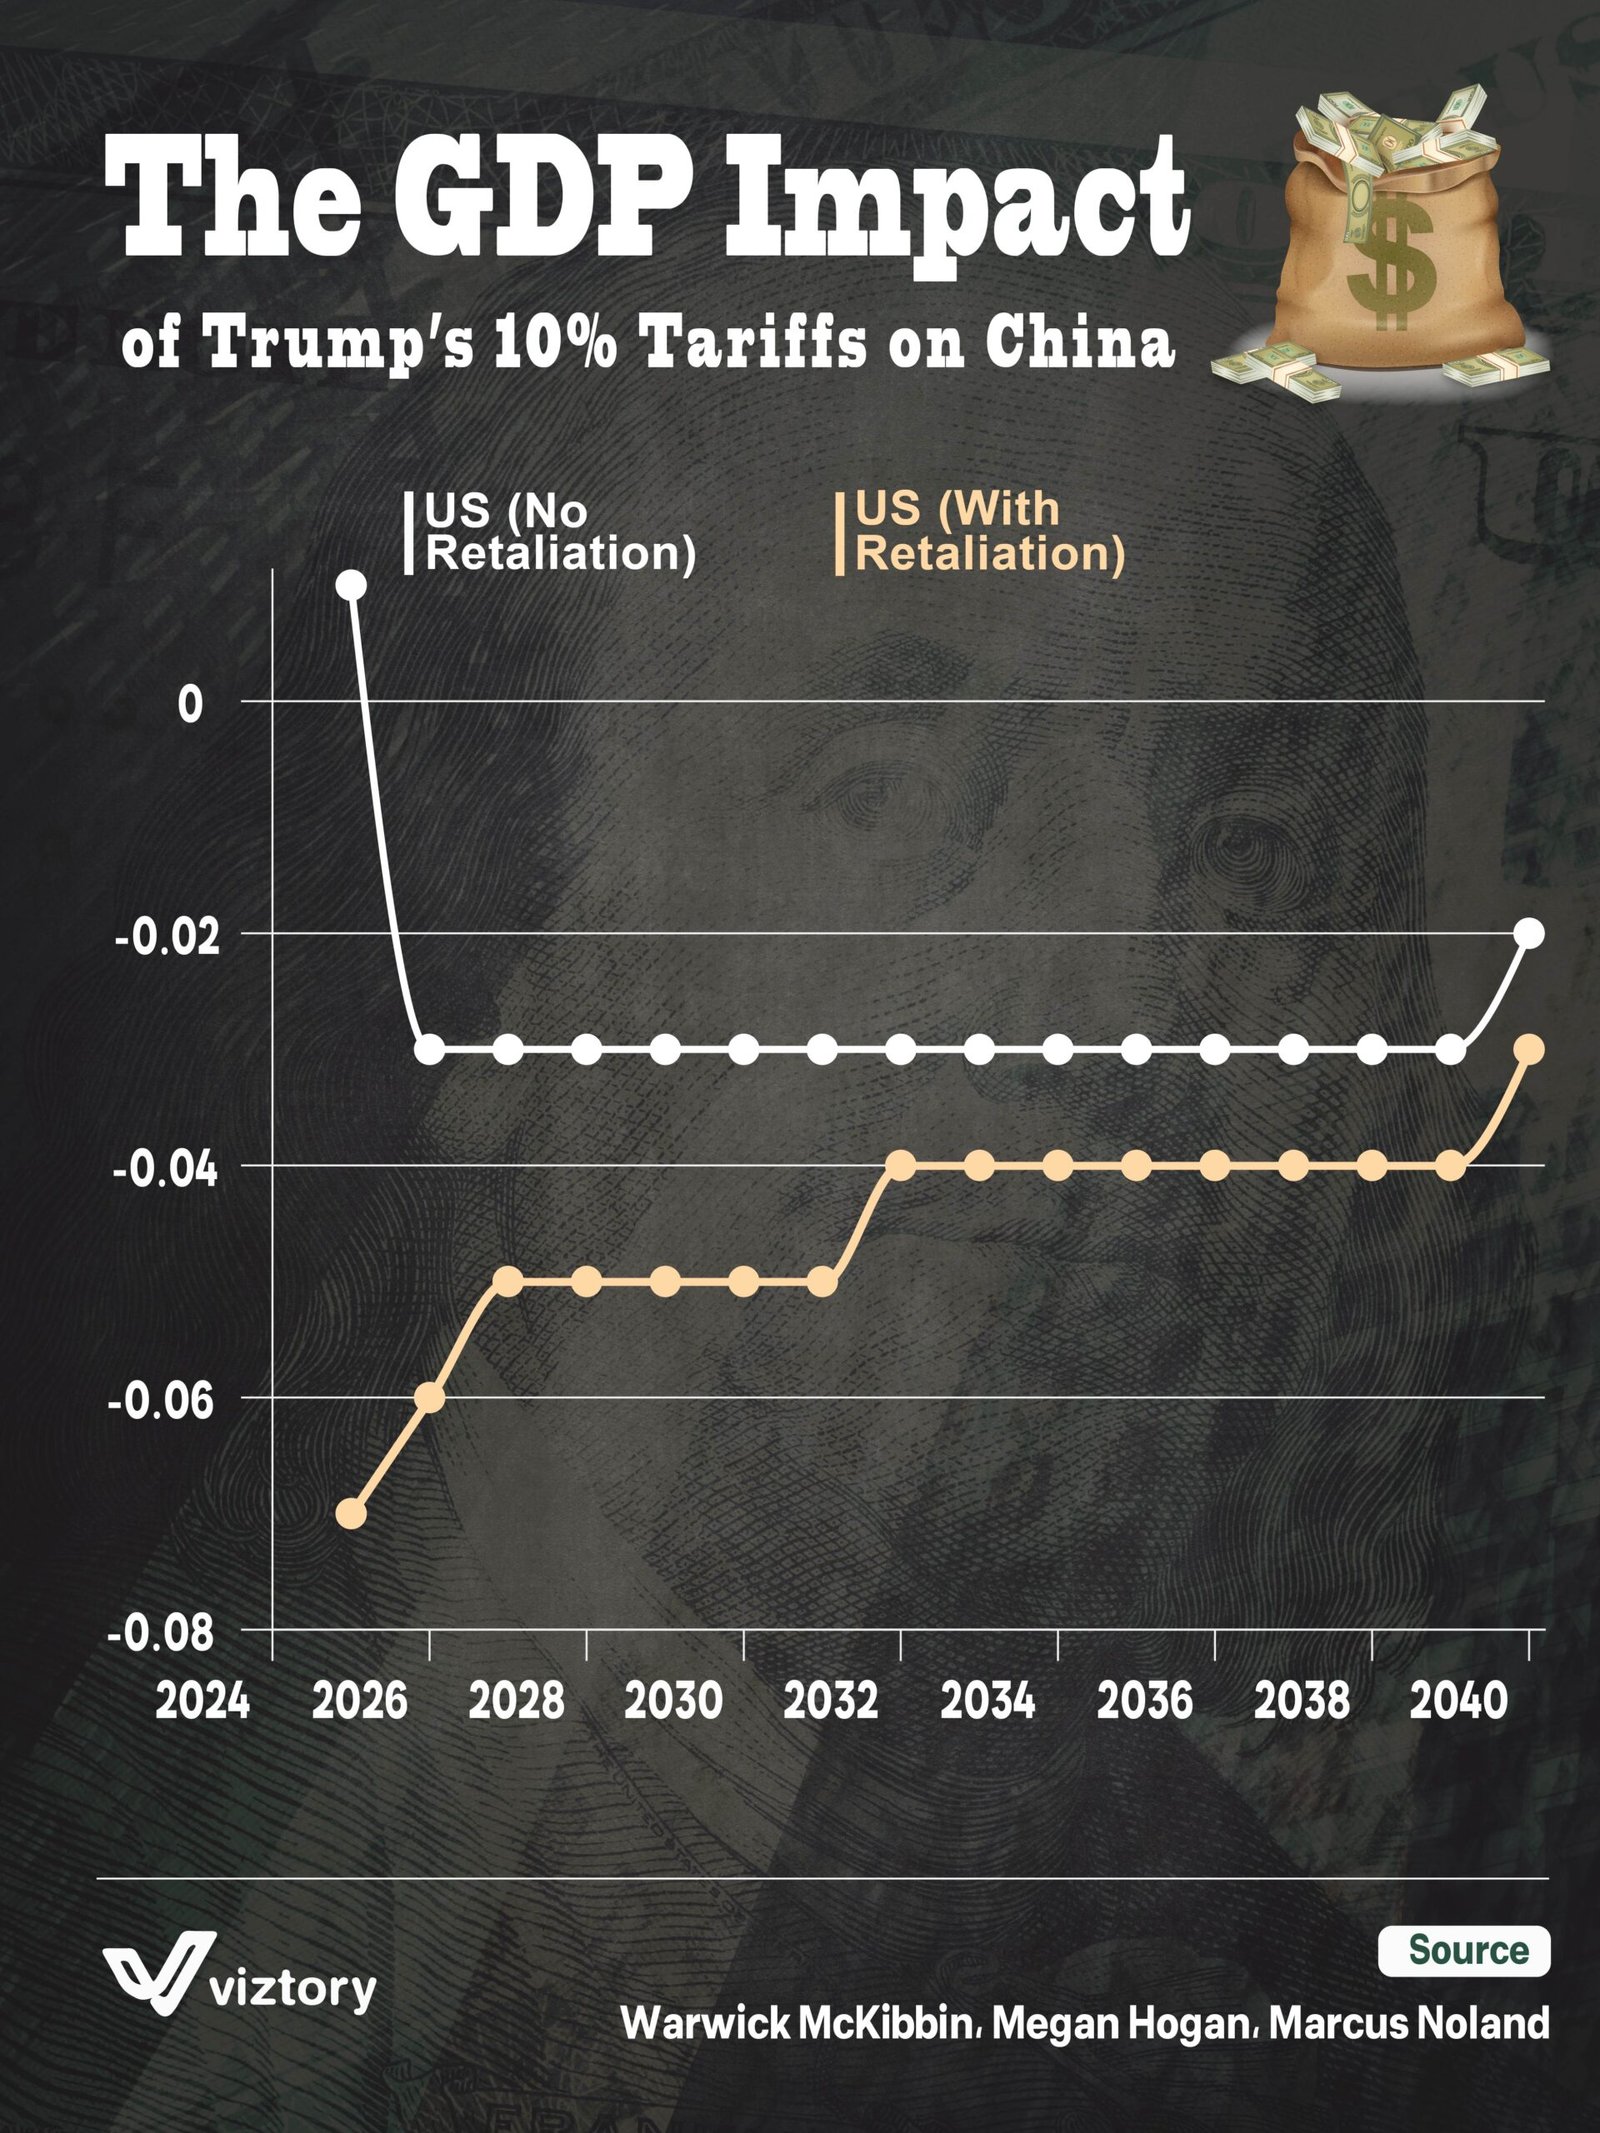
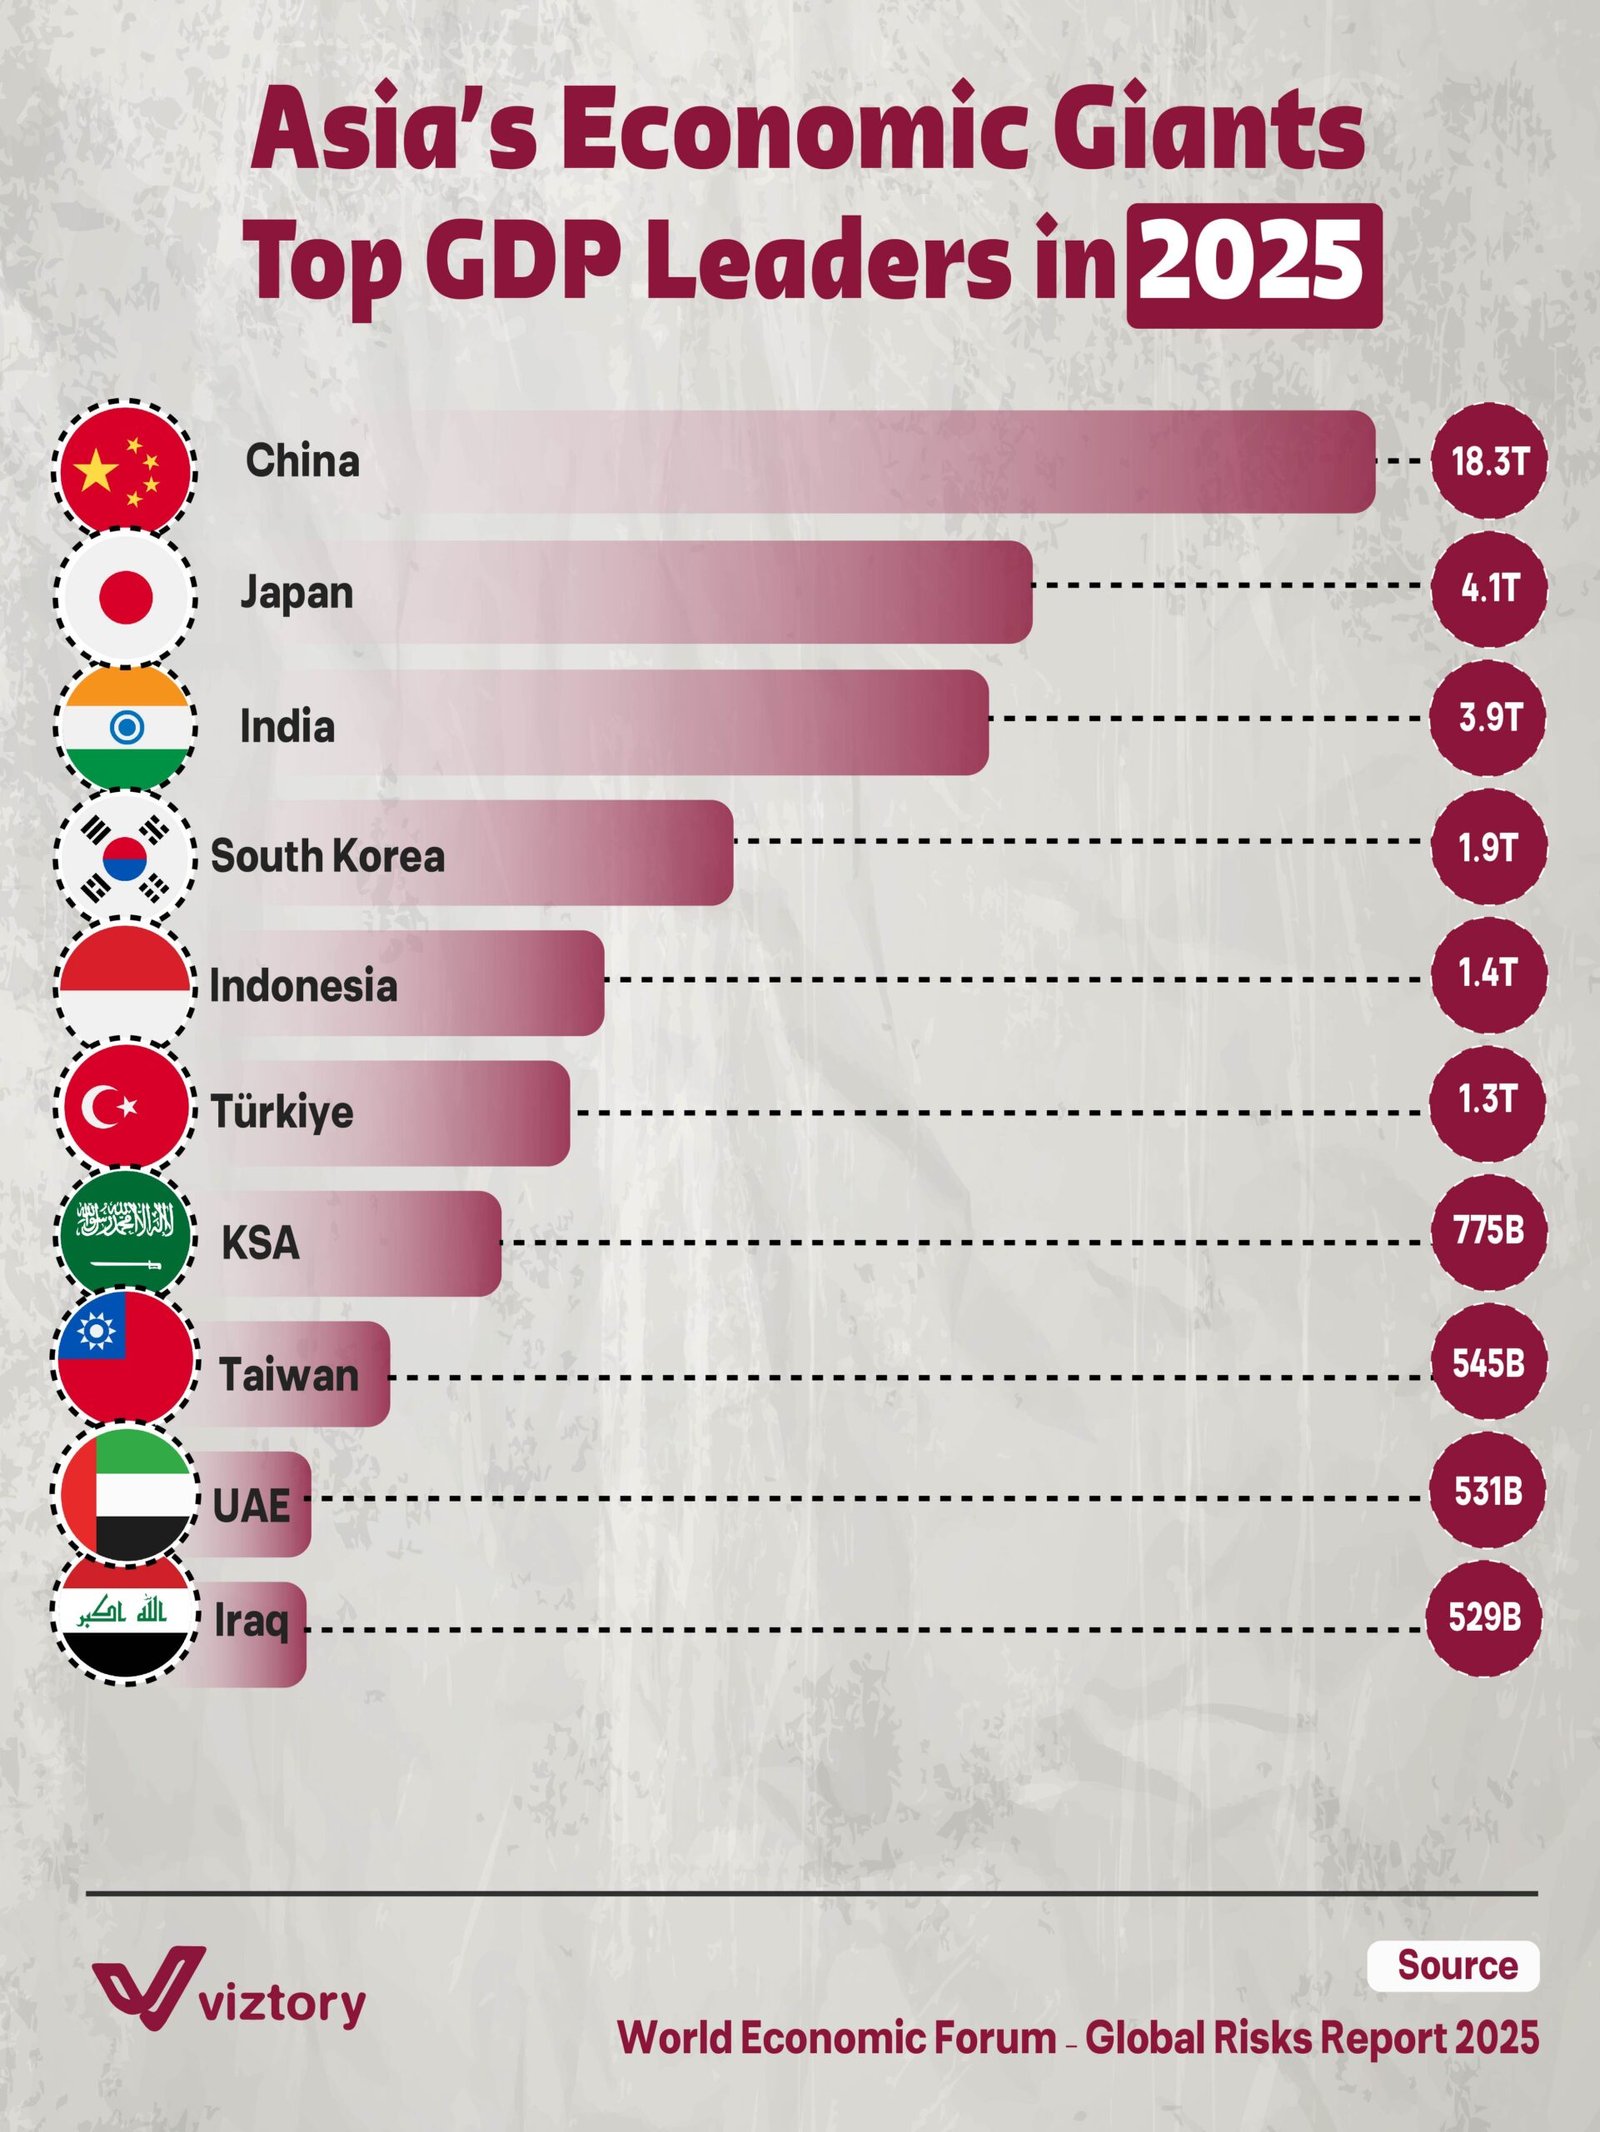
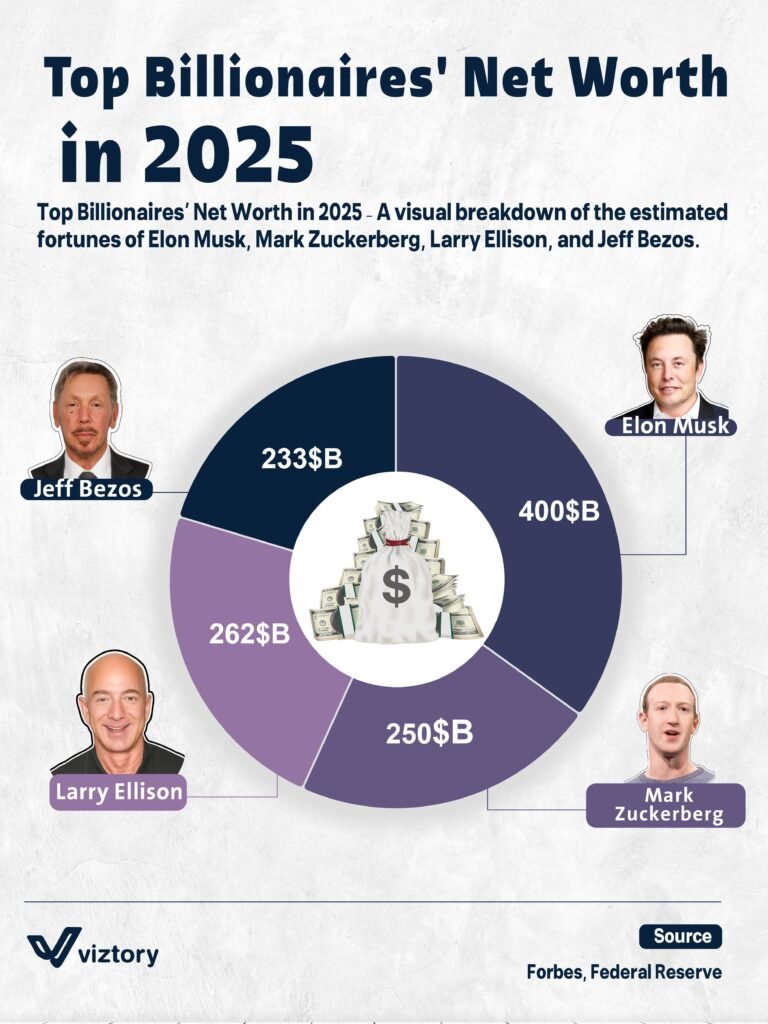
UAE’s Google Trends 2024
As we step into 2024, UAE’s Google search trends reveal a fascinating mix of global…
We’re here to provide data-driven support, transforming numbers and stats into clear insights
Discover the Power of Visualization
In a world full of data, visualization is the key to transforming numbers into valuable insights.
Through innovative designs, we strive to deliver visual solutions that help you analyze and understand data effortlessly, empowering you to make informed decisions that drive your business toward success. Join us to explore new ways of presenting information in a creative and clear manner that transforms how you perceive data.
Our areas of expertise
We create visualizations across various fields
Visualizations help arrange complex data in an understandable and organized way.
Visualizations simplify understanding relationships between data and connecting information.
Visualizations provide clear insights to support strategic decision-making.
Visualizations make information easily understandable across different devices quickly.
Stay Updated
As we step into 2024, UAE’s Google search trends reveal a fascinating mix of global…
Cancer mortality rates increase dramatically with age, particularly for individuals over 80 years old. Specific…
This visualization highlights homicide rates per 100,000 people in the United States and Europe from…
By the end of 2023, the “Magnificent 7” accounted for 30.1% of the S&P 500’s…
In 2021, Europe led the world in milk consumption with an impressive 201 kilograms of…
Food inflation has become a pressing issue in 2023–2024, with significant surges observed in countries…
Contact us
Stay Connected – Subscribe with Your Email!