Money Apr, Fri, 2025 viztaleco REAL ESTATE SECTORS: GROWTH & CHALLENGES IN 2024 Introduction The real… Read more
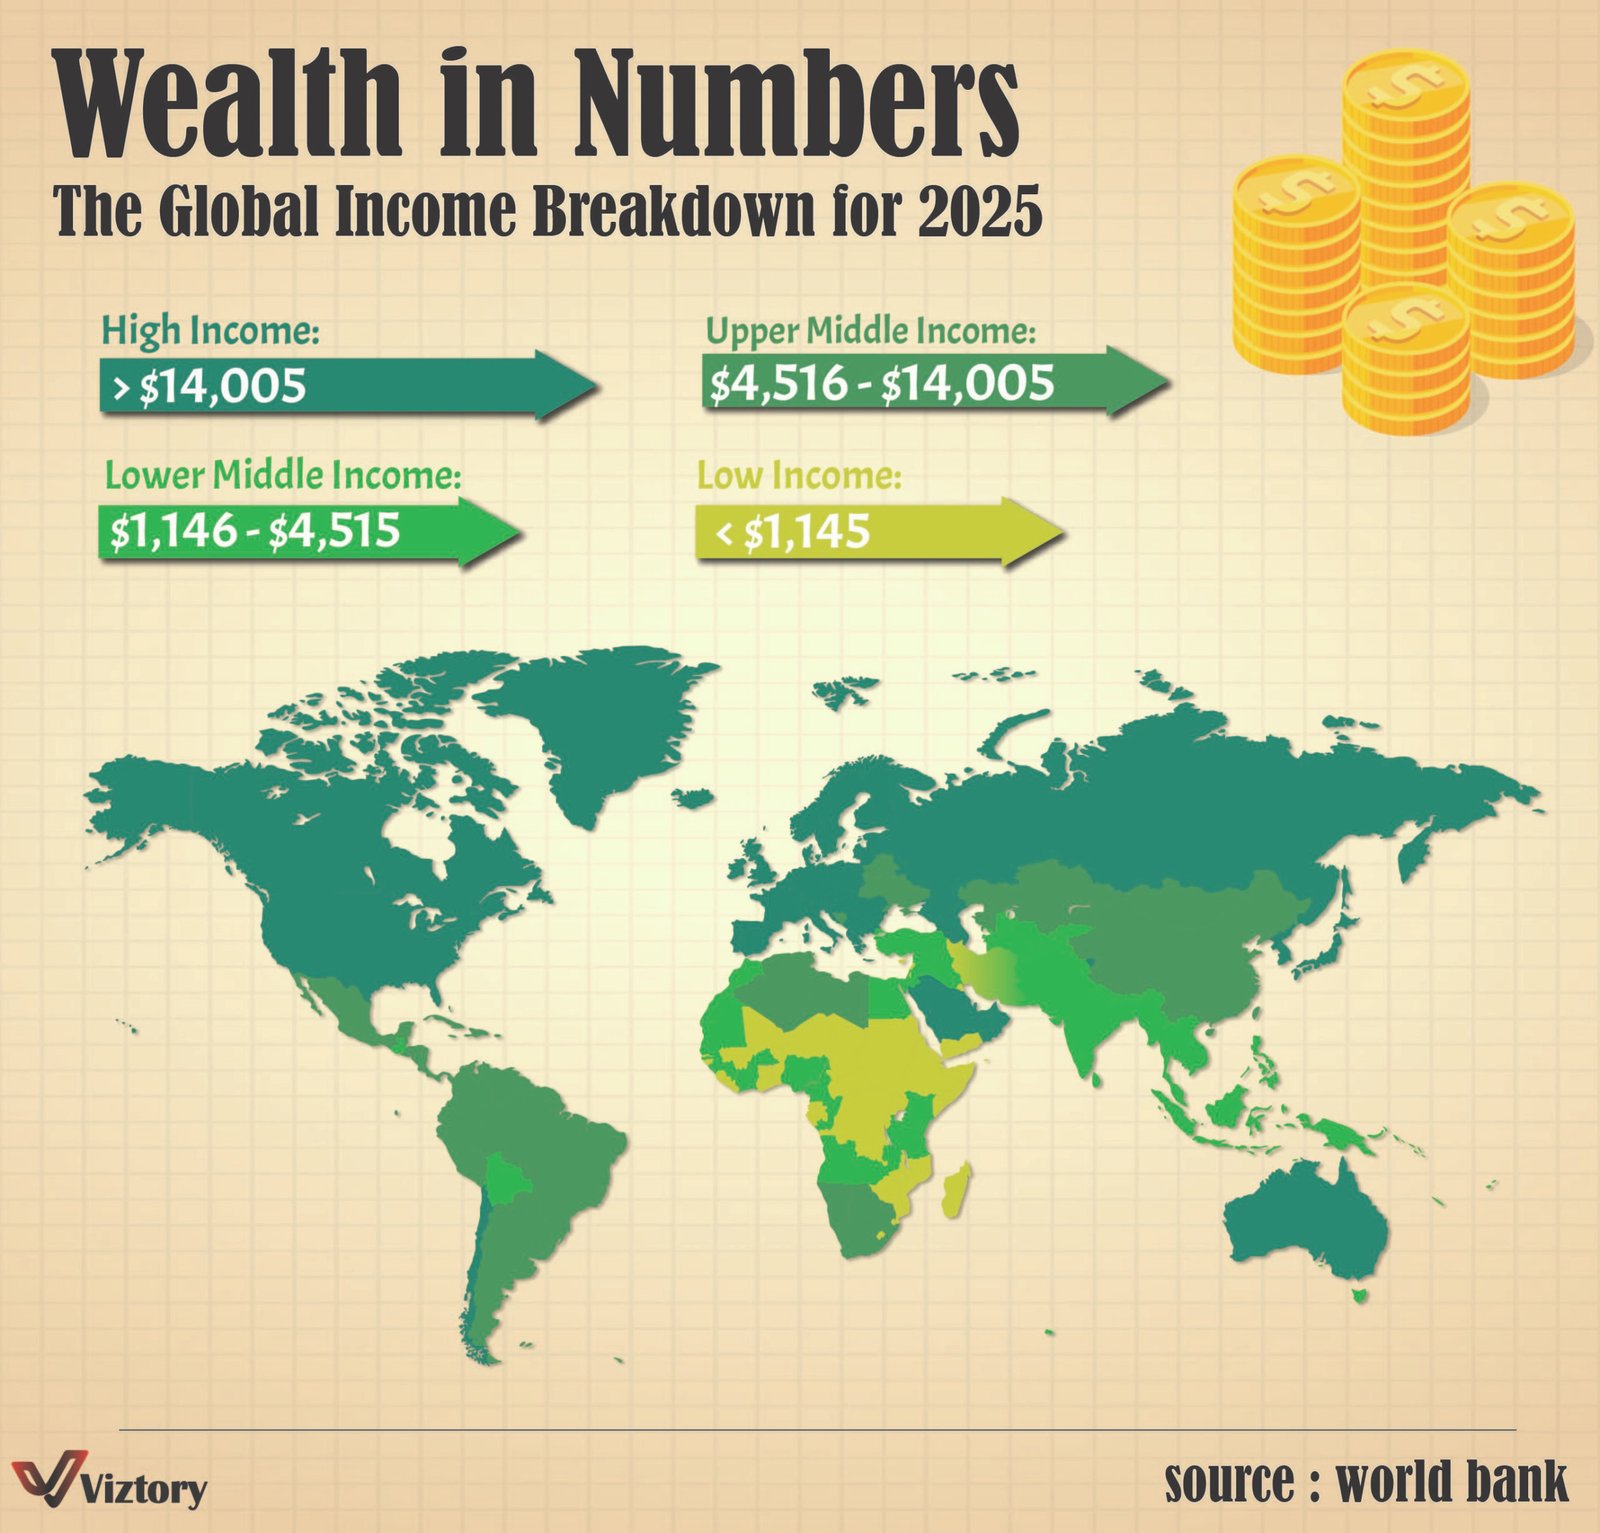
Money Apr, Sat, 2025 viztaleco Wealth in Numbers The Global Income Breakdown for 2025 Introduction As we… Read more
Money Mar, Sat, 2025 viztaleco Agricultural Workforce Shift: A Global Perspective Introduction The global… Read more
Money Mar, Sat, 2025 viztaleco WHAT AMERICA SEARCHED FOR IN 2024: TOP GOOGLE TRENDS REVEALED! Introduction Google search… Read more
Money Mar, Sat, 2025 viztaleco Starbucks Prices Soar: A Decade of Inflation! Introduction Inflation plays… Read more
Money Mar, Sat, 2025 viztaleco McDonald’s Price Surge: A Decade of Inflation! Introduction The visualization… Read more
Money Mar, Tue, 2025 viztaleco Trump vs. Biden – S&P 500 Performance Introduction The performance… Read more
Money Feb, Sat, 2025 ahmed ashour Africa’s Population Surge: Doubling by 2070? Africa, currently home… Read more
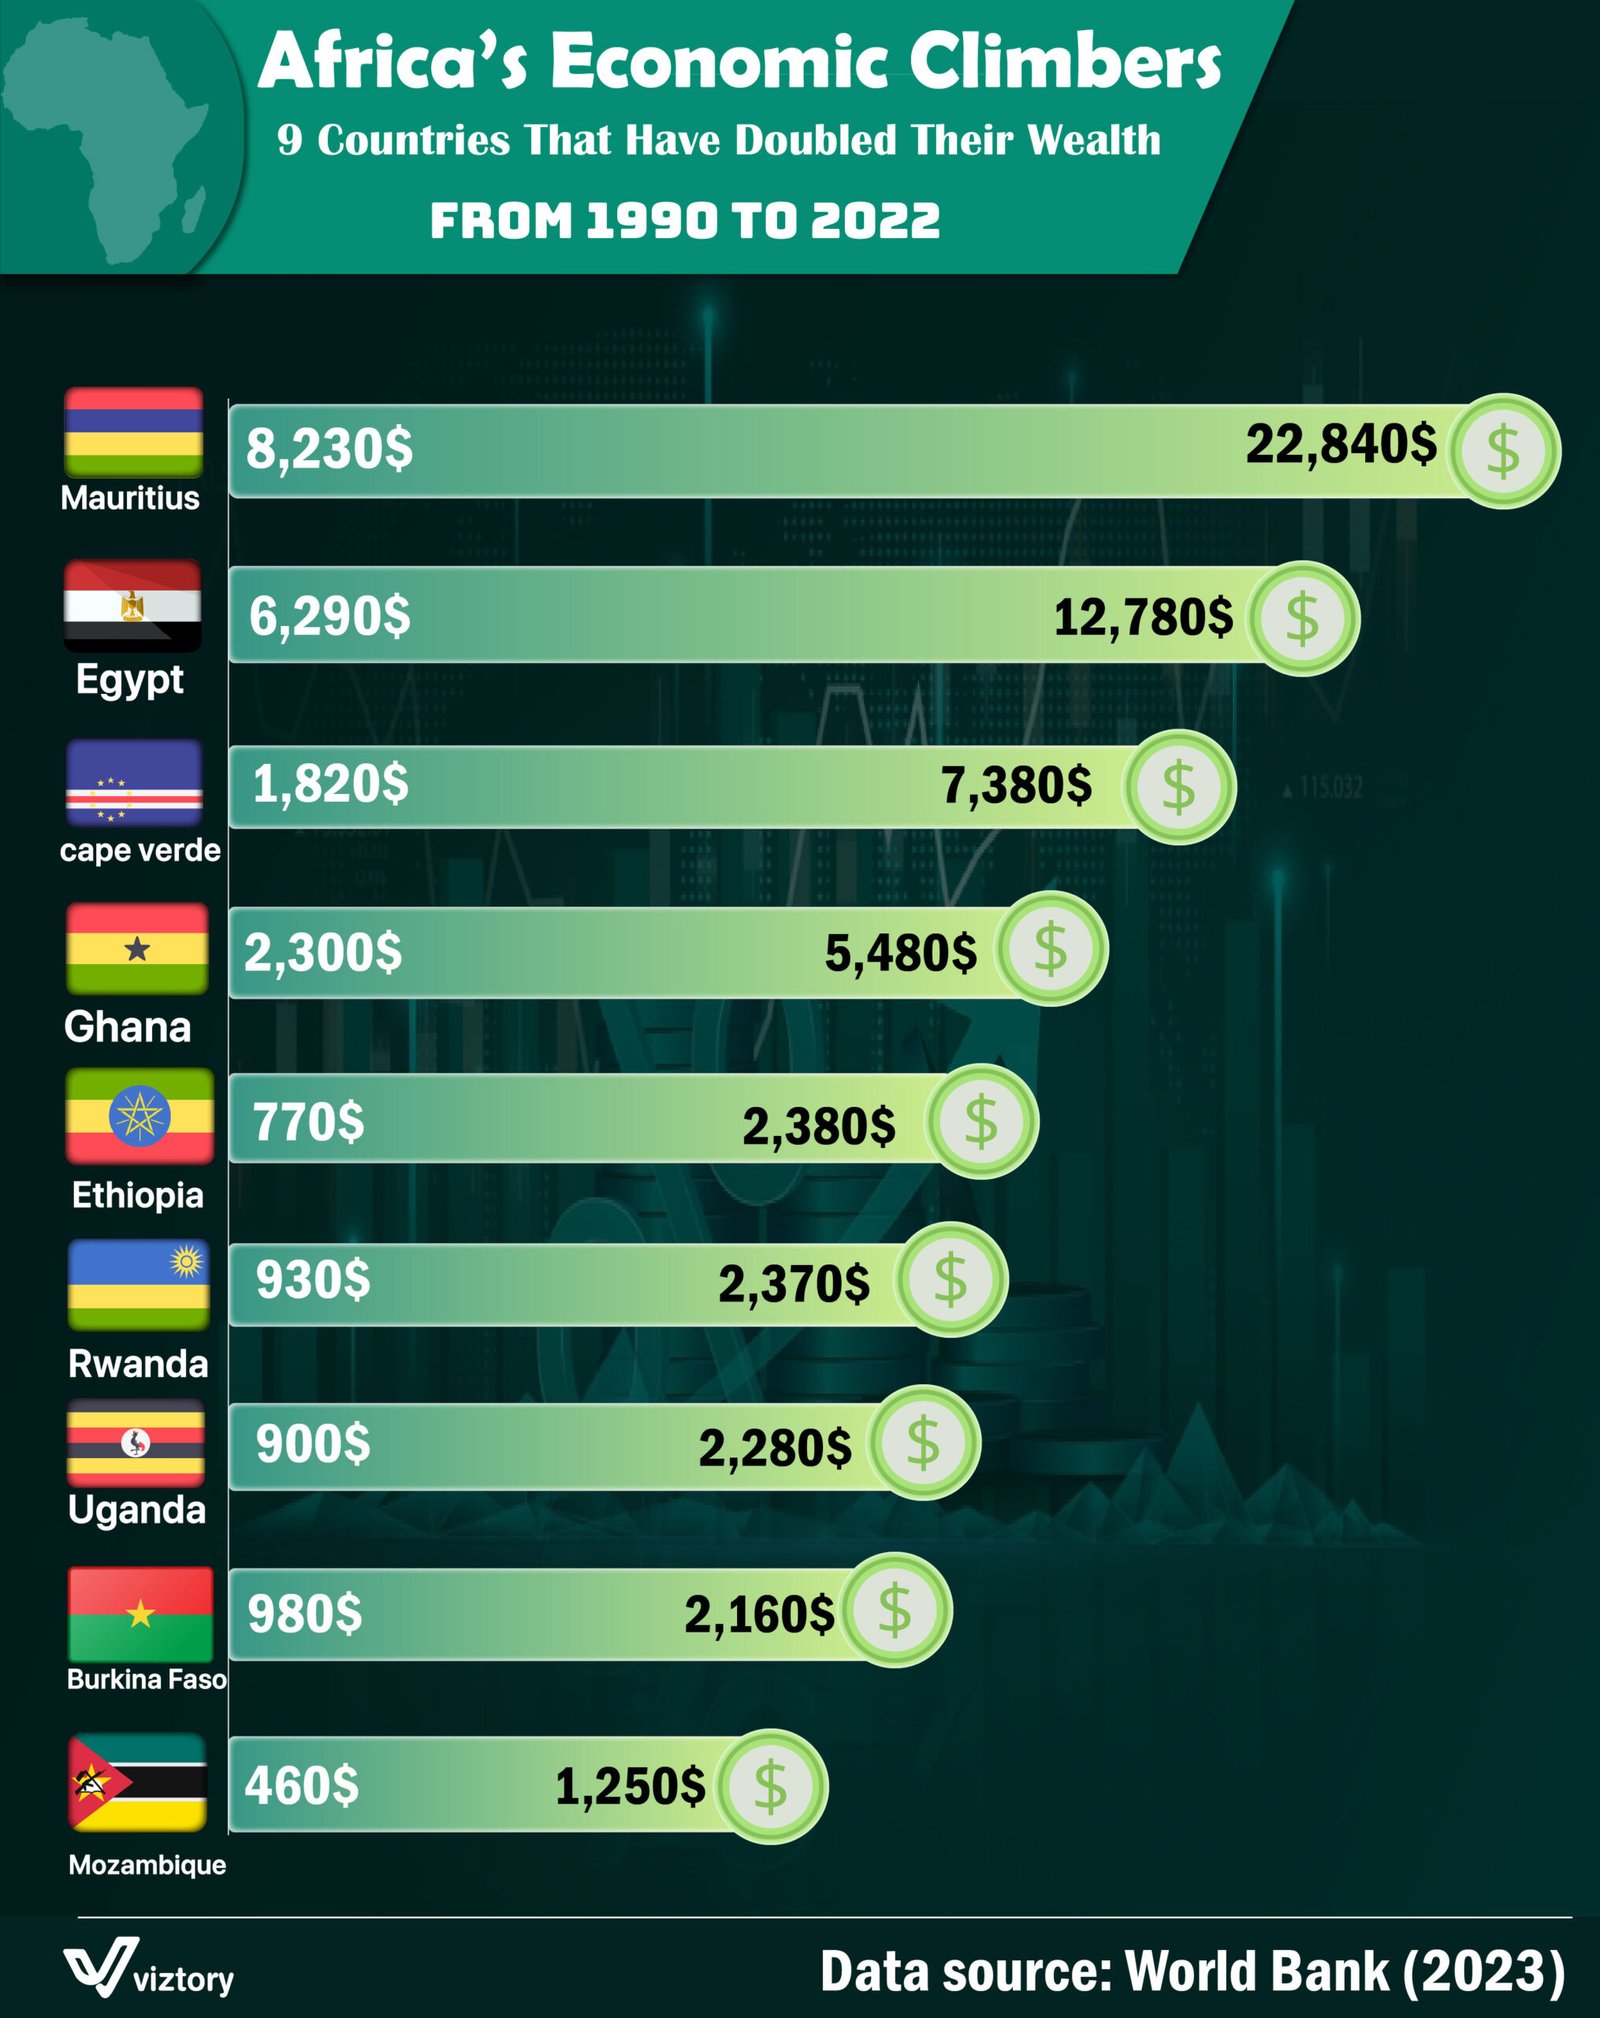
Money Feb, Sat, 2025 ahmed ashour Africa’s Economic Climbers: 9 Countries Africa is emerging… Read more