
U.S. HOUSING HEATMAP 2025
Introduction
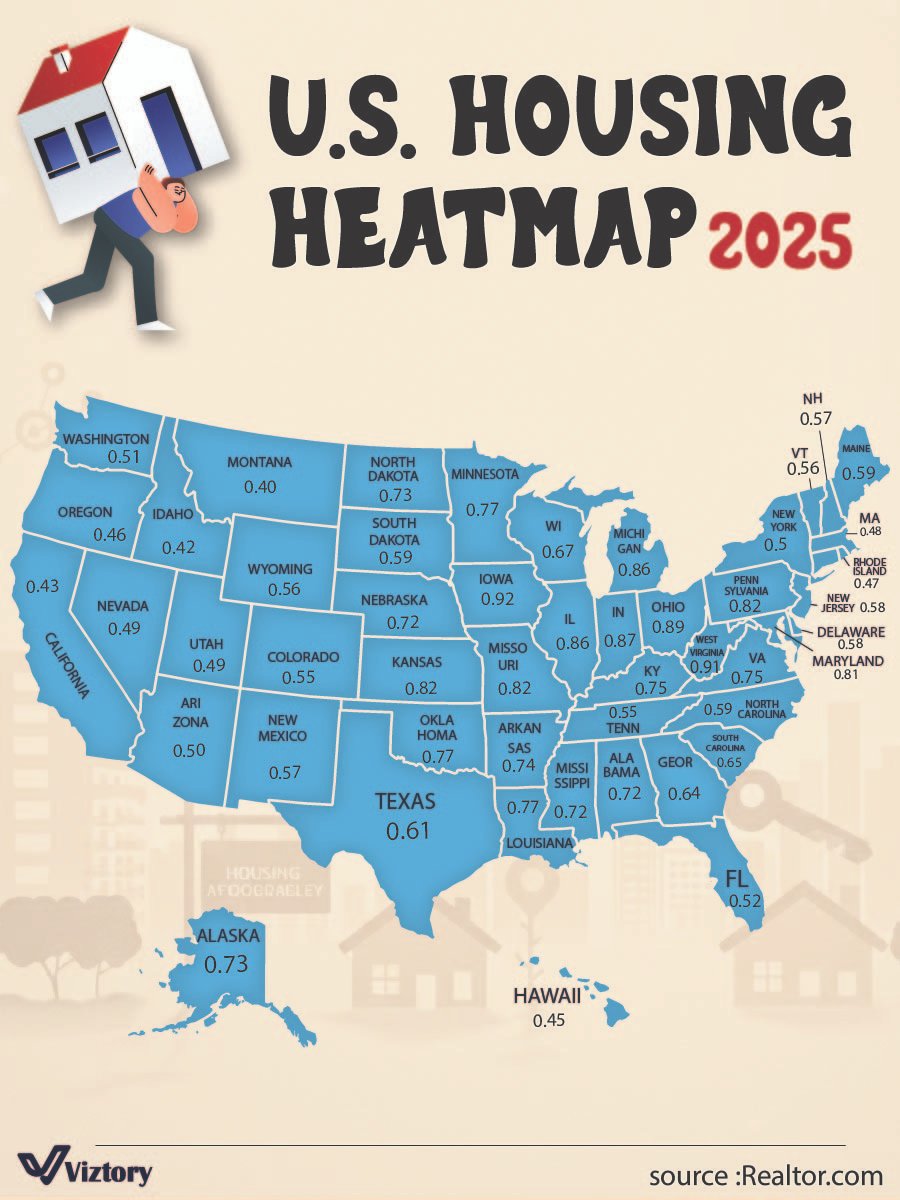
The housing market in the United States has always been a mirror reflecting the nation’s economic health, demographic shifts, and consumer sentiment. The image above, a heatmap sourced from Realtor.com and designed by Viztory, showcases the affordability index across all 50 states in 2025. Each state’s score represents the ratio of housing affordability, where a higher number suggests greater affordability relative to income.
At the core of this map lies one powerful theme: money. How much it costs, where it’s spent, and how far it stretches all come into play in the evolving American housing story.
Regional Highlights
Most Affordable States (High Index Score)
-
Iowa (0.92) – Leading the map in affordability.
-
Ohio (0.89) – A strong contender offering low cost of living with access to urban centers.
-
Michigan (0.86) and Illinois (0.86) – Affordable midwestern states with growing appeal.
-
West Virginia (0.87) – Underrated and increasingly popular for retirees and remote workers.
These states reflect a trend of midwestern and central states becoming go-to locations for families seeking affordability, especially as remote work continues to thrive.
Least Affordable States (Low Index Score)
-
Montana (0.40) and California (0.43) – Despite natural beauty, housing affordability is a challenge.
-
Hawaii (0.45) – Paradise comes at a steep price.
-
Oregon (0.46) and Rhode Island (0.47) – Urban development pressure and limited housing supply weigh heavy.
These low-score states often suffer from housing shortages, tourism-driven pricing, and limited new construction, driving up costs despite local incomes.
MONEY TALK: What the Numbers Reveal
1. Affordability = Opportunity
States like Iowa, Kansas, and Ohio aren’t just cheap—they’re potential investment hotbeds. Lower home prices mean:
-
Easier entry for first-time buyers
-
Higher ROI for real estate investors
-
Potential for long-term value appreciation as demand rises
2. Price Pressure Zones
Areas like California, Hawaii, and New York are grappling with:
-
Supply-demand imbalance
-
High property taxes
-
Limited land availability
For marketers, investors, and developers, this signals saturated and high-risk areas where only luxury or niche housing survives.
Geographic Shifts & Economic Mobility
-
Migration to the Midwest and South is accelerating due to affordability.
-
Southern states like Alabama (0.72) and Georgia (0.65) offer warmer climates and manageable costs—attractive for retirees and remote workers.
-
Texas (0.61) remains a central player—affordable by coastal standards, yet rich in economic opportunity.
MONEY flows where housing is affordable, and populations are increasingly following that current.
Strategic Insights for Stakeholders
For Buyers: Focus on states with scores above 0.80 for better mortgage-to-income ratios and higher quality of life.
For Investors: Mid-tier states with rising scores (like Tennessee or Indiana) indicate growing markets with solid rental demand.
For Policy Makers: States with scores below 0.50 may need to rethink zoning, streamline construction regulations, or invest in workforce housing.
Conclusion
The U.S. Housing Heatmap of 2025 is more than just a distribution of numbers—it’s a nationwide commentary on housing equity, economic resilience, and the power of money in shaping lives. States that strike a balance between livability and affordability are the future hubs of growth, innovation, and community.
As affordability continues to dictate migration, investment, and social development, understanding where your dollar goes furthest may be the smartest move in real estate—and life.